Linear Regression
From the book
Chapter 2: Matrix. In the chapter mind map this icon labels Feature Extraction & Linear Regression. The discussion below is excerpted and lightly edited from § Example: Feature extraction in AI in Mathematics for AI and Machine Learning.
Take six penguins from the Palmer Penguins dataset (Gorman, Williams, and Fraser, 2014), two of each species (Adélie, Chinstrap, Gentoo; the book figure Each row of $A$ holds one penguin's bill length, bill depth and flipper length (mm) and body mass (g): Each entry of $A\mathbf x$ is the dot product of one penguin's row with $\mathbf x$: flipper length minus ten times bill depth. Gentoo penguins have long flippers and shallow bills, so they score high; over all 342 penguins in the dataset, every Gentoo scores at least 46 and no other penguin scores above 35 (the book figure One matrix-vector product turns four measurements per sample into a single feature that separates a species, which is what each output of a linear layer computes.
This single feature separates Gentoo from the other two species, but it does not separate Adélie from Chinstrap. Their bill depths and flipper lengths overlap, and the chosen weight vector ignores bill length because $x_0=0$. To distinguish all three species, the layer needs more than one output feature. The matrix-matrix product below does exactly this: its additional columns can extract bill length and other measurements at the same time.
What this drawing shows
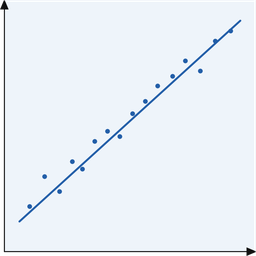
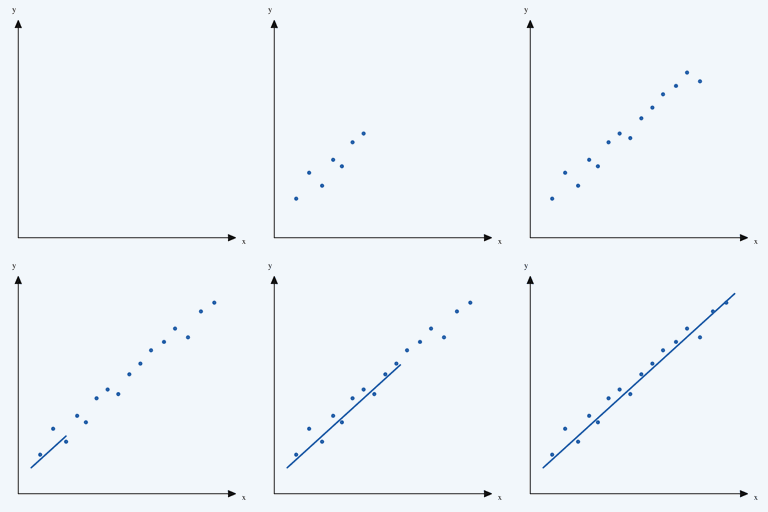
What you see. Scatter points appear sequentially, then a least-squares line grows across the plot.
In the mind map. Chapter 2 — Feature Extraction & Linear Regression. See From the book above for definitions, figures, and worked examples.
Where to read next
Read the full definitions, figures, and worked examples in Chapter 2: Matrix — see the mind-map node Feature Extraction & Linear Regression.