Paths vs Densities: Three Levels
Chapter 21: Fokker-Planck and Distribution Dynamics — Three Levels of Description
From the book
Chapter 21: Fokker-Planck and Distribution Dynamics. In the chapter mind map this icon labels Paths vs Densities: Three Levels of Description. The discussion below is excerpted and lightly edited from § Three Levels of Description in Mathematics for AI and Machine Learning.
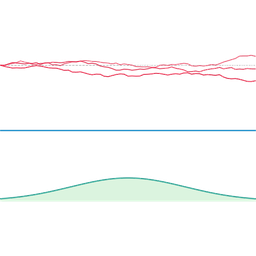
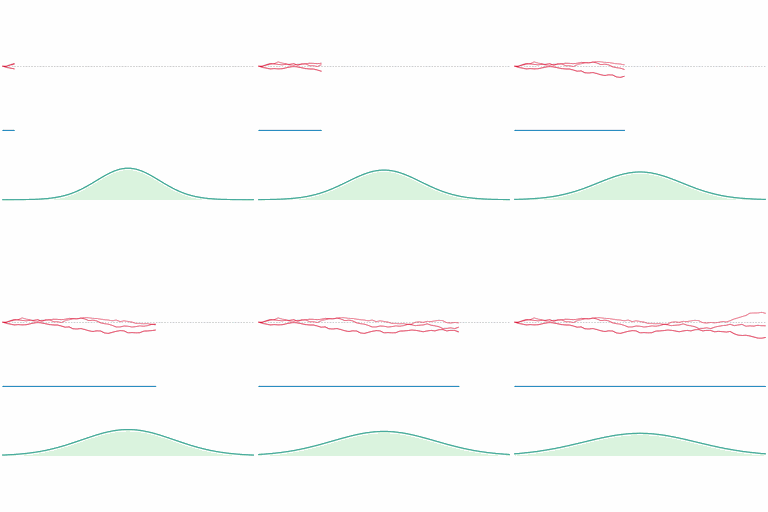
A stochastic process can now be described at three levels: individual random paths (the SDE), deterministic paths with the same marginals (the probability flow ODE), and the density $p_t(\mathbf{x})$ itself (the Fokker–Planck PDE). The last describes how probability mass flows and spreads without reference to any path, which makes it the natural level for questions of long-time behavior and convergence of diffusion processes. the book figure shows the three levels for one process: noisy crossing SDE paths, smooth non-crossing ODE paths, and the density they both follow.
What this drawing shows
What you see. Top: BM sample paths around flat mean; middle: flat probability-flow ODE; bottom: widening Fokker--Planck density as time advances.
In the mind map. Chapter 21 — Paths vs Densities: Three Levels of Description. See From the book above for definitions, figures, and worked examples.
Where to read next
Read the full definitions, figures, and worked examples in Chapter 21: Fokker-Planck and Distribution Dynamics — see the mind-map node Paths vs Densities: Three Levels of Description.